Your CRM works hard every day. But without regular maintenance, small problems compound into expensive disasters.
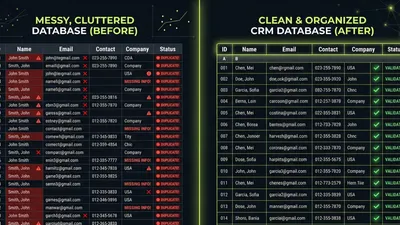
According to CRM.org research, less than 40% of companies fully implement their CRM systems. Most businesses operate with messy data, broken workflows, and underutilized features—problems that a quarterly audit would catch and fix.
If you’re still choosing the right CRM for your business, build these audit habits from day one. If you already have a CRM, this checklist will help you get more value from your existing investment.
Here are 15 things to review every quarter, organized into five categories: data quality, pipeline health, automation performance, user adoption, and reporting accuracy.
Want expert eyes on your CRM? Request a free CRM health check →
 Professional analyzing CRM data quality and records on computer screen — Regular data quality audits prevent small problems from becoming expensive disasters
Data Quality (Items 1-4)
Bad data corrupts everything else. Start your audit here.
1. Duplicate Record Count
Duplicates create confusion, waste outreach effort, and skew reports. Check your current duplicate count and compare it to last quarter.
How to check:
- Run your CRM’s built-in duplicate detection
- Pull a report of contacts with matching emails or phone numbers
- Note the total count and percentage of your database
Benchmark: Aim for less than 1% duplicates. If you’re above 5%, prioritize a CRM data cleanup before your next audit.
Red flag: Duplicate count increasing quarter over quarter signals a process problem, not just old data.
2. Critical Field Completion Rate
Empty fields mean incomplete customer profiles. Check completion rates for the fields your team actually uses.
Fields to audit:
- Email address
- Phone number
- Company name
- Job title/role
- Lead source
- Contact owner
How to check:
- Create a report filtering for records with blank critical fields
- Calculate completion percentage: (Records with field filled / Total records) × 100
Benchmark: Aim for 90%+ completion on critical fields. Below 80% indicates a data entry or enrichment problem.
3. Email Bounce Rate
Invalid emails hurt sender reputation and waste marketing effort. Review your bounce rate from the past quarter’s campaigns.
How to check:
- Pull email performance reports from your CRM or marketing platform
- Calculate: (Bounced emails / Total emails sent) × 100
Benchmark: According to ZeroBounce research, a healthy bounce rate is under 2%. Above 5% requires immediate attention—your list health is compromising deliverability.
Action if high: Run your email list through a verification service and remove invalid addresses.
4. Stale Record Percentage
Records with no recent activity are likely outdated. B2B contact data decays at roughly 22.5% annually—if you’re not refreshing data, a quarter of your database goes bad every year.
How to check:
- Report on records with no activity in the past 12 months
- Calculate: (Stale records / Total records) × 100
Benchmark: Keep stale records under 20% of your active database. Consider archiving or re-engagement campaigns for records older than 12 months.
Pipeline Health (Items 5-8)
Your pipeline tells you where revenue is coming from—if it’s accurate.
5. Deals Stuck in Stage
Deals that sit in one stage too long indicate either a stalled opportunity or a rep who isn’t updating the CRM.
How to check:
- Report on deals by stage with “days in stage” metric
- Identify deals exceeding your average cycle time for that stage
Benchmark: No deal should sit in a stage for more than 2x your average time in that stage. According to First Page Sage research, optimal sales cycles range from 46-75 days total—adjust stage benchmarks accordingly.
Action: Review stuck deals with sales managers. Are they truly stalled, or just not updated?
6. Win Rate by Stage
Understanding where deals fall out helps you focus improvement efforts.
How to check:
- Calculate conversion rate between each pipeline stage
- Compare to previous quarters
Benchmark: First Page Sage data shows professional services achieve 28% win rates while real estate sees 16%. Know your industry benchmark and track movement.
Red flag: Sharp drops between specific stages indicate a process problem at that handoff point.
7. Pipeline Coverage Ratio
Do you have enough pipeline to hit your target? Coverage ratio tells you.
How to check:
- Total pipeline value / Revenue target = Coverage ratio
Benchmark: Traditional wisdom says 3x coverage, but this varies by win rate. If you win 33% of deals, you need 3x. If you win 20%, you need 5x. Calculate based on your actual win rate.
Action if low: Either generate more pipeline or improve win rates—both are valid responses.
8. Average Deal Size Trend
Is your average deal growing, shrinking, or staying flat? This metric reveals pricing pressure and market shifts.
How to check:
- Calculate average closed-won deal value for the quarter
- Compare to previous quarters
Red flag: Declining deal size with stable close rates often indicates discounting pressure or market commoditization.
Want help analyzing your pipeline metrics? Schedule a CRM consultation →
 Sales team reviewing pipeline metrics and deal progress on screen — Pipeline health metrics reveal both sales performance and CRM discipline
Automation Performance (Items 9-11)
Automations save time—until they break. Audit them quarterly.
9. Workflow/Sequence Enrollment Counts
Are your automations actually running? Check enrollment numbers.
How to check:
- Review each active workflow or sequence
- Note total enrollments for the quarter
- Compare to expected enrollment based on triggers
Red flag: Zero or near-zero enrollments on an active workflow means something is broken—either the trigger conditions are wrong or the workflow is silently failing.
10. Email Sequence Performance
Sequences are only valuable if they generate engagement. Review performance metrics.
Metrics to check:
- Open rates by sequence and step
- Reply rates
- Unsubscribe rates
- Meeting/conversion rates
Benchmark: Sequence emails should perform within 10-20% of your overall email benchmarks. Dramatically lower performance indicates messaging problems or list quality issues.
Action: Pause underperforming sequences. Either fix them or retire them—don’t let bad automation run indefinitely.
11. Task Automation Accuracy
Automated tasks should help reps, not create noise. Audit task creation.
How to check:
- Review automated task types and volumes
- Survey reps: Are automated tasks useful or just clutter?
- Check task completion rates for automated vs. manual tasks
Red flag: Low completion rates on automated tasks often means reps have learned to ignore them. Either the tasks aren’t valuable or they’re too generic.
 Team members actively engaged with CRM software at their workstations — User adoption determines CRM ROI more than features
User Adoption (Items 12-14)
A CRM nobody uses has negative ROI. Track adoption metrics quarterly.
12. Login Frequency
The most basic adoption metric: Are people logging in?
How to check:
- Pull login reports by user
- Calculate average logins per user per week
- Identify users with zero or minimal logins
Benchmark: Daily logins for active sales reps. CRM.org research shows sales teams spend only 18% of their time in CRM applications—but they should still be logging in daily.
Action for low-login users: Investigate. Is it a training issue, a usability issue, or a motivation issue? Each requires a different solution—our guide on getting your team to actually use the CRM covers all three.
13. Activity Logging Rates
Logins don’t matter if reps aren’t logging activities. Check data entry behavior.
How to check:
- Report on activities (calls, emails, meetings) logged per rep
- Compare to expected activity based on role and quota
- Identify reps with suspiciously low activity counts
Red flag: Reps hitting quota with minimal logged activity are probably working outside the CRM. That’s a data trust problem waiting to happen.
Benchmark: If a rep makes 50 calls per day, your CRM should show approximately 50 calls per day. Large gaps indicate logging problems.
14. Feature Utilization
Are teams using the features you’re paying for?
How to check:
- List the key features included in your CRM tier
- Audit usage of each: sequences, workflows, reporting, integrations
- Calculate utilization: (Features actively used / Features available) × 100
Benchmark: You should be using at least 70% of the features you’re paying for. Below 50% suggests either overbuying or undertraining.
Action: Either train teams on underused features or downgrade to a tier that matches actual usage.
Reporting Accuracy (Item 15)
15. Report Reliability Check
Reports are only useful if people trust them. Test accuracy quarterly.
How to check:
- Pick 3-5 key reports your team relies on
- Manually verify a sample of the data (10-20 records)
- Check: Do the numbers match reality?
Common accuracy problems:
- Deals counted in wrong stage
- Revenue attributed to wrong owner
- Date filters pulling incorrect ranges
- Custom fields not populating correctly
Action if inaccurate: Fix the root cause—usually data entry, field configuration, or filter logic. A report everyone ignores because “the numbers are never right” is worse than no report at all.
Benchmark: Sample checks should match report output 95%+ of the time. Consistent discrepancies indicate systematic problems.
Your Quarterly Audit Schedule
Don’t try to audit everything in one day. Spread it across the quarter:
| Week | Focus Area | Time Required |
|---|---|---|
| Week 1 | Data Quality (Items 1-4) | 2-3 hours |
| Week 2 | Pipeline Health (Items 5-8) | 2-3 hours |
| Week 3 | Automation Performance (Items 9-11) | 1-2 hours |
| Week 4 | User Adoption (Items 12-14) | 1-2 hours |
| Week 4 | Reporting Accuracy (Item 15) | 1 hour |
Total quarterly investment: 7-11 hours. That’s less than two hours per month to prevent data disasters and maximize CRM value.
 Professional methodically reviewing CRM audit checklist on clipboard — A structured quarterly audit takes less than two hours per month
Tracking Your Audit Results
Create a simple tracking document to measure progress:
| Metric | Q1 | Q2 | Q3 | Q4 | Target |
|---|---|---|---|---|---|
| Duplicate % | <1% | ||||
| Critical field completion | >90% | ||||
| Bounce rate | <2% | ||||
| Stale records % | <20% | ||||
| Average days in stage | [Your benchmark] | ||||
| Win rate | [Your benchmark] | ||||
| Daily logins | 100% of active users | ||||
| Feature utilization | >70% |
Tracking quarter over quarter reveals trends. A single bad metric might be noise. Three quarters of decline is a pattern requiring action.
Key Takeaways
- Quarterly audits catch problems before they become expensive disasters
- Data quality is the foundation—start every audit with duplicate and completion checks
- Pipeline metrics reveal both sales performance and CRM discipline
- Automation only saves time if it’s working—verify enrollment and performance
- User adoption determines CRM ROI more than features
- Reports nobody trusts are worse than no reports at all
What to Do Next
Start with the area that concerns you most:
- Worried about data quality? Run items 1-4 this week
- Pipeline feels unclear? Focus on items 5-8
- Automations seem broken? Audit items 9-11
- Team resistance? Start with items 12-14
If multiple areas feel problematic—or you don’t have time to run a proper audit—we can help. Our CRM health check covers all 15 items plus recommendations specific to your situation.
Want experts to run through this checklist for you? Our professional CRM audit covers all 15 items and more—with actionable recommendations you can implement immediately.
Matt Adams
Matt Adams is the Founder of MapMatix, an Australian living in Idaho who's passionate about all things automation and AI. He helps businesses streamline their operations through smarter CRM implementations and workflow automation.